In this guide
A KPI (key performance indicator) is a number that tells you quickly whether something important is going well. Here are the 15 that matter most for restaurants, bars and lounges, grouped into four families, with formulas.
Sales KPIs
1. Total sales (by day, service and category)
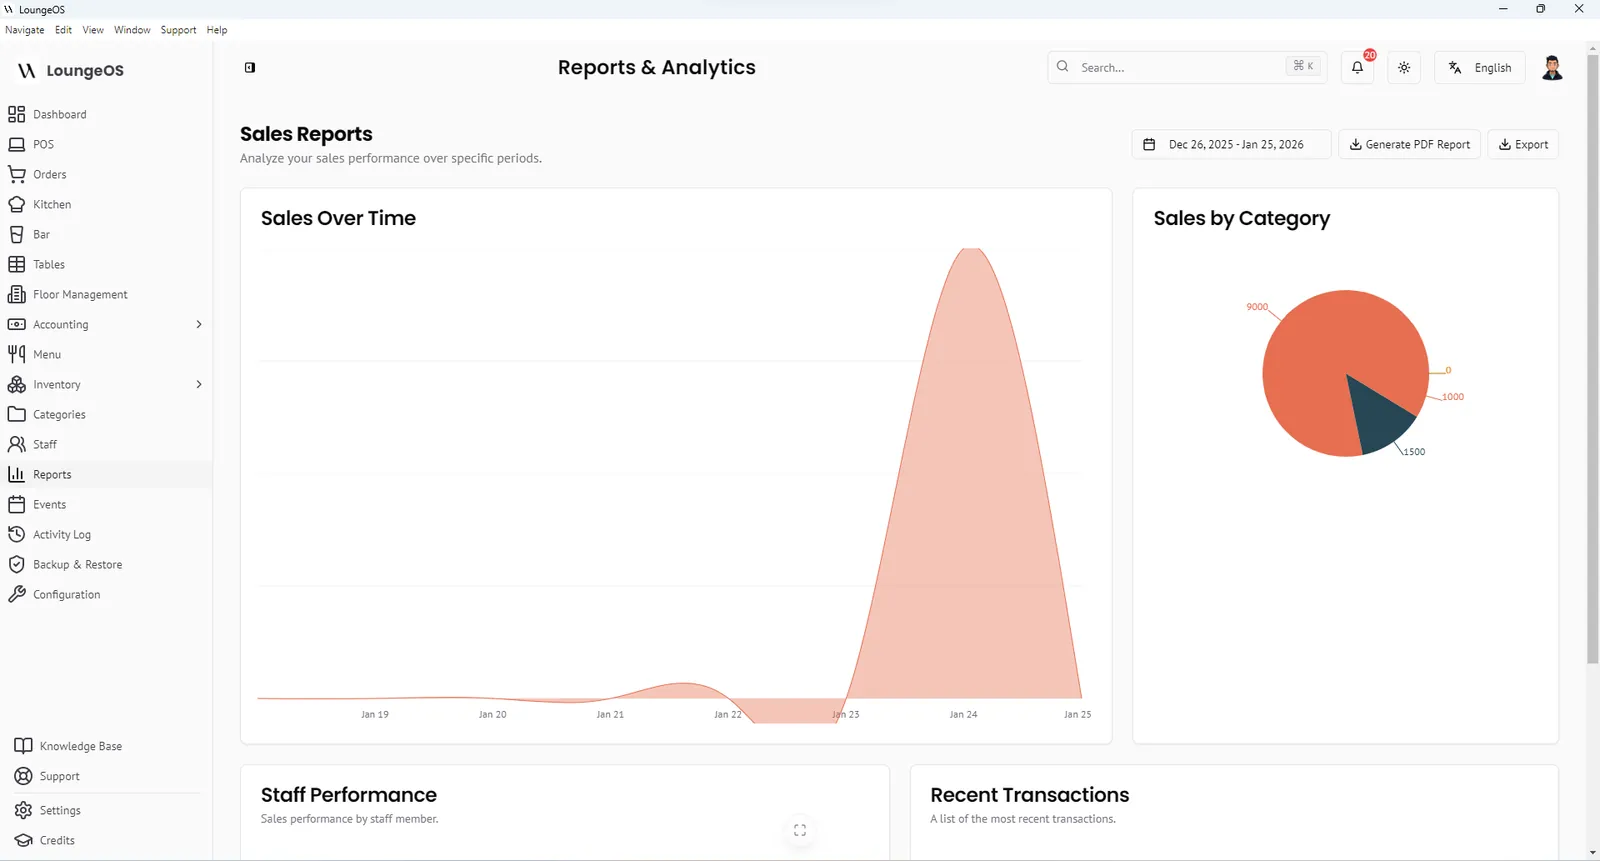
The starting point. Break it down by day of week, service (lunch or dinner) and category (food, beer, spirits). In LoungeOS, the dashboard shows total revenue and daily sales, and reports show sales over time and by category.
2. Covers (guests served)
The number of guests. Track it if you can, because it powers several other KPIs.
3. Average check
Average check = Total sales ÷ Number of bills (or ÷ covers for spend per head)
Rising average check means upselling works. Falling average check can mean discounts or under-ringing.
4. Sales per server
Sales per server = Sales attributed to a server ÷ hours worked
Find your best performers and coach the others. LoungeOS shows staff performance with orders and revenue per person.
5. Category mix
Category % = Category sales ÷ Total sales
A shift from spirits to beer changes your margin even if total sales are flat.
Cost KPIs
6. Food cost %
(Opening food inventory + purchases − closing inventory) ÷ food sales
See the full guide: food cost percentage.
7. Pour cost % (beverage cost)
(Opening drinks inventory + purchases − closing) ÷ drink sales
Typical bar pour costs are often around 18–24% overall. See bar shrinkage and pour cost.
8. Labour cost %
Total labour cost (wages + charges) ÷ total sales
9. Prime cost %
(COGS + total labour) ÷ total sales
The single most useful cost KPI. Many operators aim for 60–65% or less.
10. Net profit margin
Net profit ÷ total sales
From your P&L. Full-service restaurants often report 3–6%.
Speed KPIs
11. Table turnover rate
Table turnover = Number of parties served ÷ number of tables (per service)
A 20-table restaurant serving 50 parties at dinner turns tables 2.5 times.
12. Ticket time
Time from order to ready in the kitchen. A kitchen display shows where tickets wait. Track your slowest dishes and your slowest hours.
Control KPIs (theft early warning)
13. Cancellation / void rate
Void rate = Value of cancelled items ÷ total sales, by staff member
A rate well above the team average for one person, especially with “customer left” reasons, deserves a look. See POS permissions.
14. Discount rate
Discount rate = Total discounts ÷ gross sales, by staff member
Discounts should follow your rules and promotions, not individual generosity.
15. Inventory variance and turnover
Variance = Expected stock − counted stock (by value)
Inventory turnover = COGS ÷ average inventory value
Variance shows leaks. Turnover shows whether cash is stuck on shelves. Food usually turns fast. Spirits and wine turn more slowly.
A one-page weekly dashboard
| KPI | This week | Last week | Target |
|---|---|---|---|
| Total sales | |||
| Average check | |||
| Food cost % | 28–35% | ||
| Pour cost % | your ideal + 2 pts | ||
| Labour % | |||
| Prime cost % | ≤ 60–65% | ||
| Void rate (highest staff member) | near team average | ||
| Discount rate | per your promotions | ||
| Top 5 stock variances (value) | → 0 |
Fill it every Monday in 15 minutes. Trends matter more than any single week.
Where to find these numbers in LoungeOS
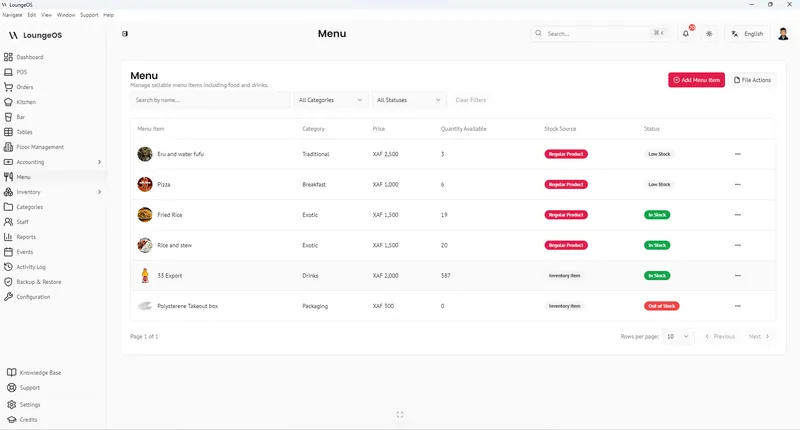
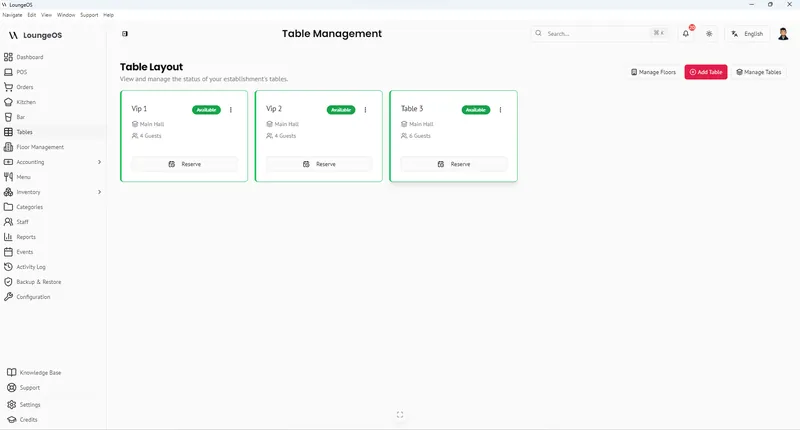
- Dashboard: total revenue, daily sales, orders, cancelled orders, active tables
- Reports & analytics: sales over time, sales by category, staff performance, recent transactions
- Inventory: stock value, movements, low stock, recorded losses
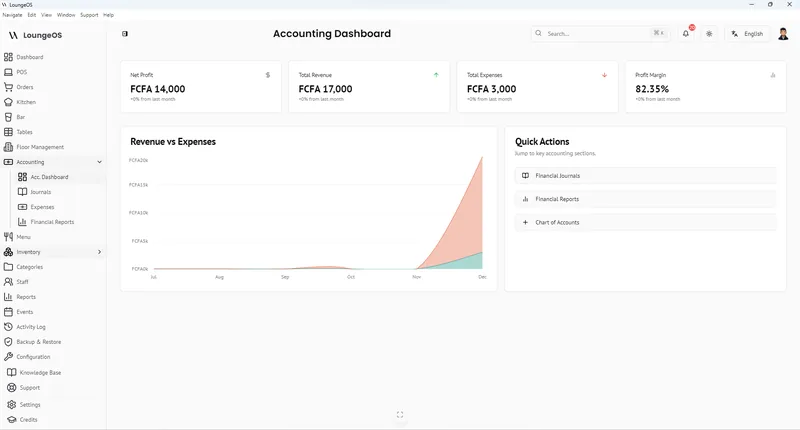
- Accounting: P&L, balance sheet, cash flow after syncing
- Activity log: cancellations with reasons, by user and time
Run your next service on LoungeOS
Install LoungeOS on a Windows computer, connect your tablets and phones over Wi-Fi, and run real service for 30 days. Free, no credit card.
Frequently asked questions
What are the most important KPIs for a restaurant?
Prime cost %, food cost %, pour cost %, labour cost %, average check, table turnover and net profit margin. Add void and discount rates by staff member as control KPIs.
How do you calculate table turnover?
Divide the number of parties served by the number of tables for the same service. For example, 50 parties at 20 tables = 2.5 turns.
How often should a restaurant review KPIs?
Sales and control KPIs weekly, cost KPIs weekly or monthly after inventory counts, and the full P&L monthly.
What KPI shows employee theft?
No single KPI proves theft. Void and cancellation rates, discount rates and stock variance by product, compared across staff and over time, are the strongest early warning signs.