In this guide
Drinks are usually the highest-margin part of a bar or lounge. They’re also the easiest to lose: a bottle is small, valuable and easy to hide, and a generous pour looks like good service. Vendors of bar inventory tools often quote shrinkage of 15–20% of beverage inventory for bars without tight controls. Those figures come from companies selling solutions, so treat them as a warning, not a benchmark. Measure your own number. This guide shows how.
Two numbers every bar owner should know
Pour cost (beverage cost percentage)
Pour cost % = Cost of beverages used ÷ Beverage sales × 100
Where:
Cost of beverages used = Opening stock value + Purchases − Closing stock value
Example (one week, FCFA):
- Opening stock value: 850,000
- Purchases (deliveries): 600,000
- Closing stock value: 700,000
- Cost used: 850,000 + 600,000 − 700,000 = 750,000
- Beverage sales recorded in the POS: 3,000,000
- Pour cost: 750,000 ÷ 3,000,000 = 25%
Benchmarks
Analyses of bar data by BevSpot put total pour costs for many bars at around 18–24%, with medians of about 24% for beer, 15% for spirits and 28% for wine (BevSpot). Your target depends on your mix and prices. A beer-heavy bar in Douala will run a different pour cost from a cocktail lounge. The most useful comparison is your actual pour cost against your ideal pour cost.
Ideal (theoretical) pour cost
Ideal pour cost = Σ (units sold × unit cost) ÷ beverage sales
This is what your pour cost would be if every drink sold was poured exactly right and nothing was lost. Your POS sales by item give you units sold, and your stock records give you unit costs.
The gap between actual and ideal is your problem to solve. If ideal is 22% and actual is 25%, three points of sales are leaking. On 3,000,000 FCFA a week, that’s 90,000 FCFA a week, or about 4.7 million a year.
Shrinkage: finding which bottles disappear
Pour cost tells you how much you lose. Shrinkage per product tells you where.
Expected stock = Opening count + Received − Sold − Recorded losses
Shrinkage = Expected stock − Actual count
| Product | Opening | Received | Sold (POS) | Recorded loss | Expected | Counted | Shrinkage |
|---|---|---|---|---|---|---|---|
| Local beer 65 cl | 240 | 480 | 610 | 4 | 106 | 98 | 8 |
| Imported beer 33 cl | 120 | 144 | 190 | 0 | 74 | 61 | 13 |
| Whisky 70 cl | 18 | 12 | 22 | 0 | 8 | 6 | 2 |
Two whisky bottles cost more than eight local beers. Rank shrinkage by value, not by count, and start with the top of the list.
Where bar stock really goes
- Over-pouring. Free-pouring spirits without measures adds up quickly.
- Unrecorded breakage and spills. A broken bottle that isn’t logged looks exactly like theft.
- Free drinks. For friends, regulars or staff, without being rung up or recorded.
- Unrung sales. The drink is served and paid in cash, but never entered.
- Under-ringing. A premium drink is sold but a cheaper one is entered.
- Receiving errors. Delivery notes say 20 crates, the truck brought 19.
- Theft from storage. Bottles leave through the back door.
How to cut shrinkage: the routine
Daily
- No ticket, no drink. Bartenders prepare only what appears on the bar display.
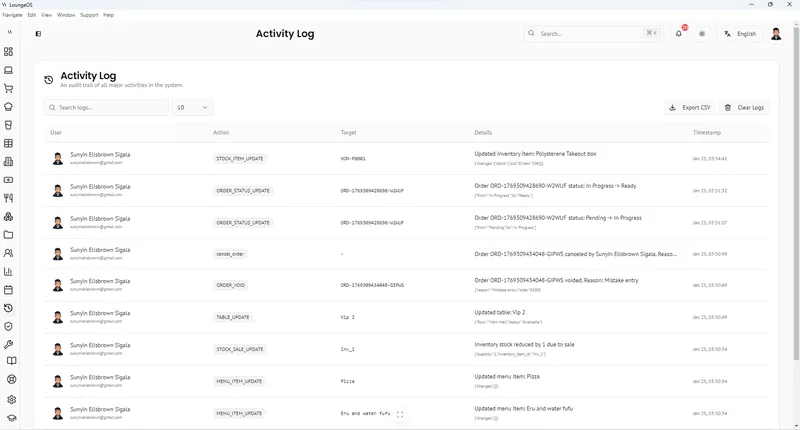
- Record breakage immediately as damage or loss with a reason. In LoungeOS this is a Stock out entry with the user’s name.
- Use measures (jiggers) for spirits and standard glassware.
Weekly
- Count your top 20 products by value, same day and time each week, before opening.
- Compare expected with counted for each one.
- Review recorded losses by staff member. Breakage should be rare and spread out.
- Check cancellations and discounts at the bar.
Monthly
- Full stock count and pour cost calculation.
- Compare actual vs ideal pour cost and agree on one improvement for next month.
Every delivery
- Count against the delivery note before signing.
- Record stock in right away, with the actual unit cost.
How LoungeOS helps
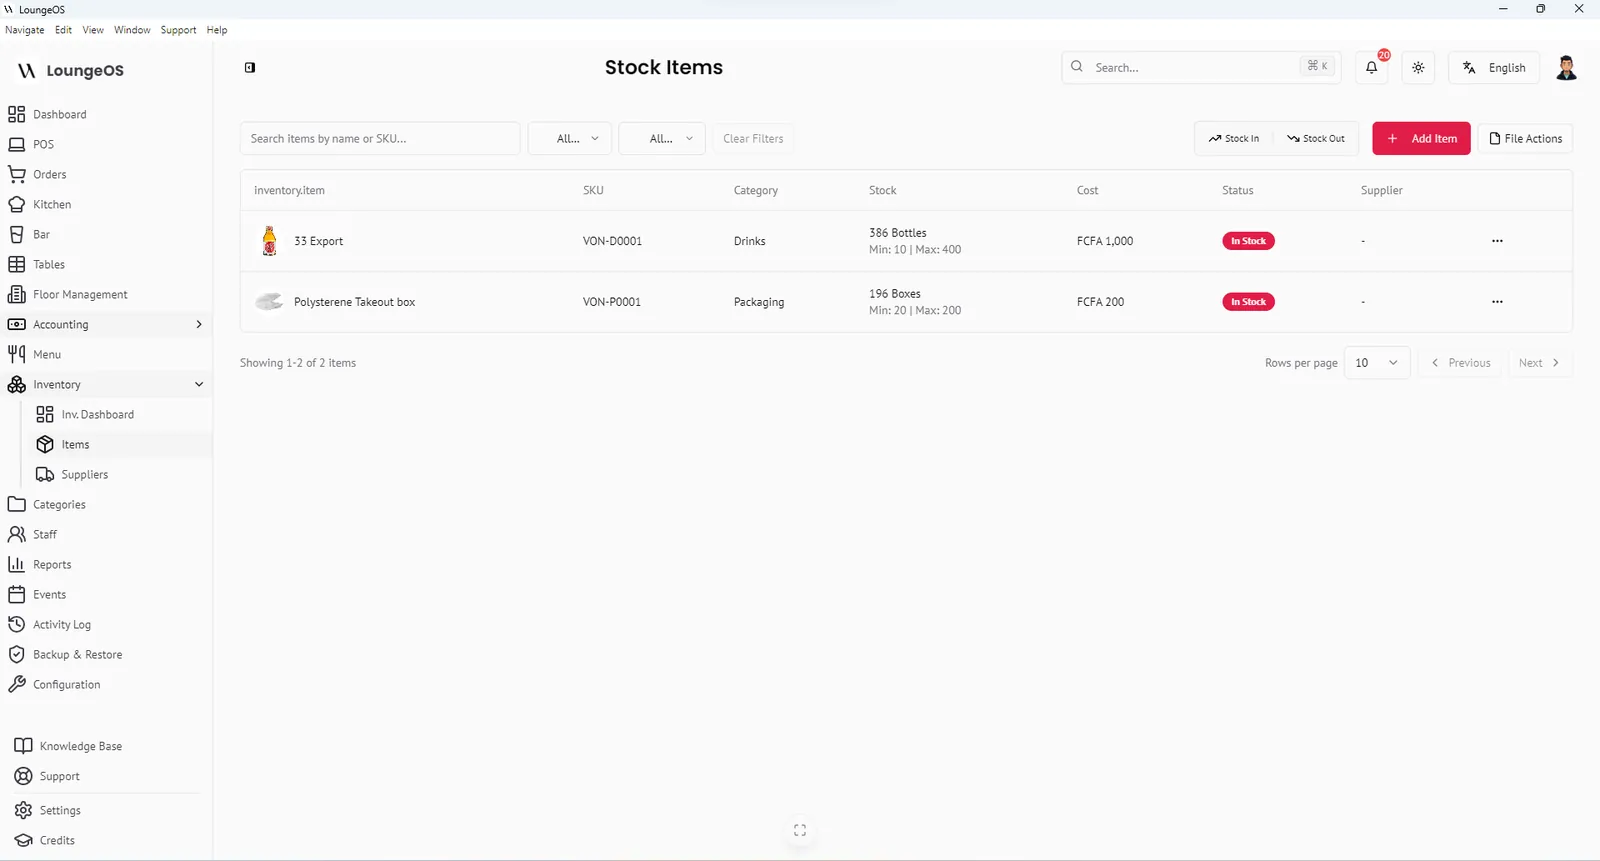
- Every drink is a stock item with unit, cost price and minimum level.
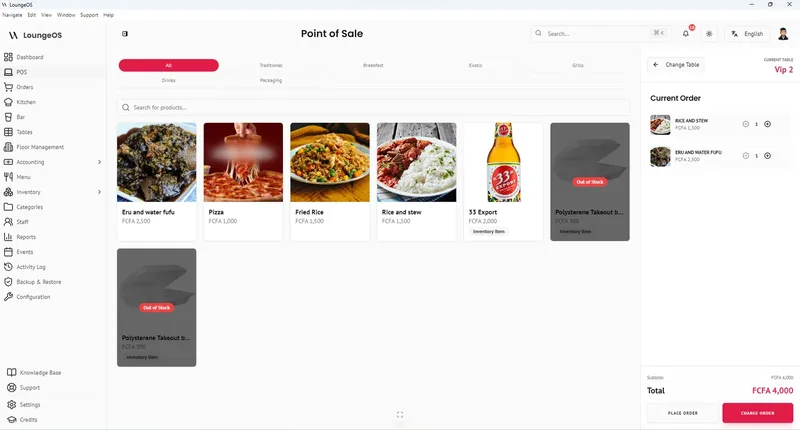
- Drinks route to the bar display, so the bar prepares only what was ordered.
- Stock out (damage/waste/loss) entries record who, what and why. Movements are exported for any date range.
- Removing a drink from a sent order needs a manager, and cancellations need a reason. See loss prevention.
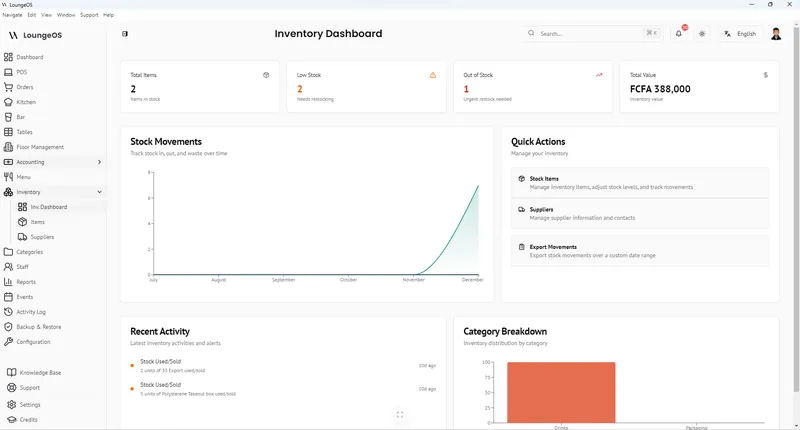
- The inventory dashboard shows total stock value, so opening and closing values for the pour cost formula are one screen away.
Run your next service on LoungeOS
Install LoungeOS on a Windows computer, connect your tablets and phones over Wi-Fi, and run real service for 30 days. Free, no credit card.
Frequently asked questions
What is a good pour cost for a bar?
Analyses of bar data put typical total pour costs around 18–24%, with spirits usually lower than beer and wine. The right target depends on your product mix and prices. Compare your actual pour cost with your ideal pour cost.
How do you calculate bar shrinkage?
For each product: expected stock = opening count + received − sold − recorded losses. Shrinkage = expected stock − actual count. Rank products by the value of the shrinkage.
How often should a bar count inventory?
Count high-value products weekly and do a full count monthly. Count at the same time each week, before opening, for consistent results.
How can I stop bartenders from giving free drinks?
Make “no ticket, no drink” a rule enforced by a bar display, record every breakage with a name, review cancellations and discounts weekly, and compare stock variance per product.